
I go over the steps to make a model :
1/Prepare the model on paper. Draw the borders and choose the border conditions. Then divide the borders in lines or sinecurves, of which you calculate the parameters (begin and endpoint for a line, and length, amplitude, ... for a sine). Determine the order of the borders COUNTERCLOCKWISE.
2/Open K2dGrFlow and click on 'new document', in the taskbar. Then click on 'save document' and choose a good name for your model. The application will stor a file with name.gfm.
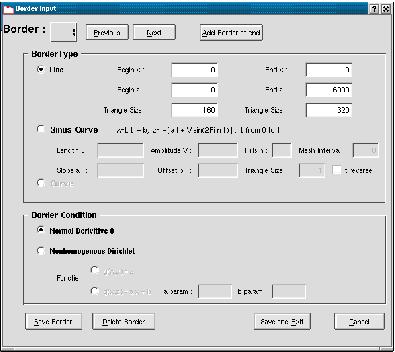
3/Click on "Input Borders" in the task bar. A dialog opens in wich you can give, one by one, the borders of the domain, just like you've put them on paper. If not clear wat to put in the box 'triangle size', put a tenth of the length of the line you're entering. This will make sure 10 triangles will lay on that border. Beware for the sinus. You must give a Mesh Interval, telling by how many lines the sinus is approximated. You also give the triangle size, but make sure that that is smaller than the interval lenght you get with setting Mesh Interval.
4/Press on the button 'Domain' and also on the button 'BorderMesh'. This shows the domain on the right hand side of K2dGrFlow. Check if this is indeed correct.
5/Click on 'generate mesh' in the task bar, and then on the button 'Mesh' to see the mesh that has been generated. Beware, the mesh is generated by the external programm EasyMesh, so it's not an integral part of our application. De pid is given of this programm, so you can follow it up. If you start K2dGrFlow from a Terminal, you can follow the progress of the EasyMesh programm..
6/If the mesh is ok, you must input the d-parameter on the left. This parameter gives the drop of of the conductivity with the depth. When d=0, conductivity remains constant, when d=0.00235 we have a 10% drop of conductivity with the depth. When d has been given, you click on 'Run Model' in the task bar. The application determines the unknown phi(x,z), the hydraulic head. When K2dGrFlow was started in a terminal, you can follow the progress of this algorithm. The result is stored in a file name.u
7/As soon as the solution is known, you can view it with the button 'FEM'. You get a contourdiagram of the hydraulic head. The flow lines are perpendicular to these lines, and go from high head(blue) to low head (red).
Here's a screenshot of K2dGrFlow on which you can see a domain that has a generated mesh.
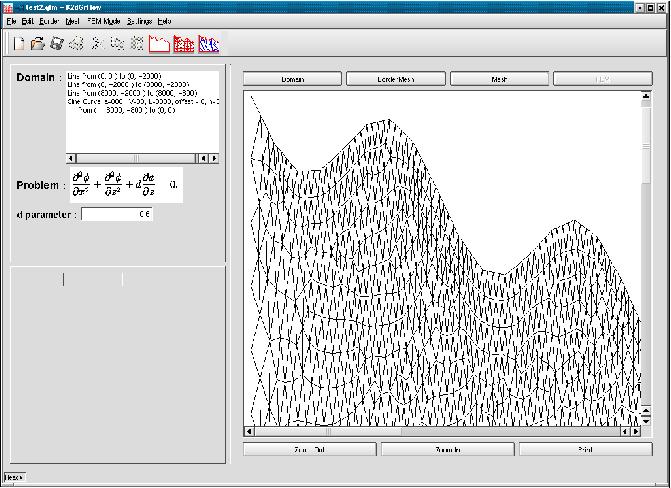
There are not many extra features implemented yet. You can zoom in and out of the figure, but not very interactive. You can also print the resulting images to a printer.
As an extra you can call the external ShowMesh programm. This is delivered together with EasyMesh, and displays a generated mesh, with better zooming possibilities then K2dGrFlow gives. Some bugs in it though.