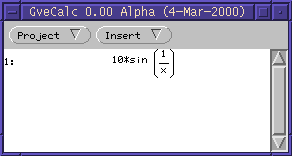
Just enter the formula.
The * stands for multiplication and with / you can make
fractions. With the arrow keys you can walk around the formula.
When your formula is finished, press [Return]:
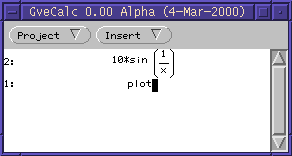
When you type plot
and push [Return], the graph is drawn:
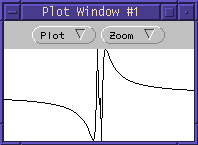
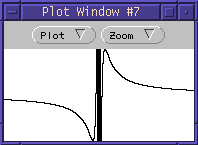
The graph is shown between x=-10..+10 and y=-10..+10. Using the Zoom
menu, you can zoom in and out. The center of the plot is currently not
adjustable.
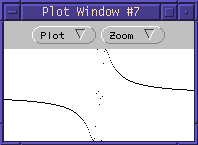
In the Plot menu, some methods of plotting the function are available:
Dots plots some points of the graph. When the
function value changes too fast, `holes' are clearly visible:
Connected dots does the same, but connects the
points with lines.
Intervals draws the graph using an interval method.
PENDING: more info about the different plotting
methods.